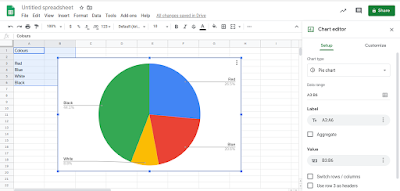
In maths we have learnt how to put graphs, charts in our devices and also others so the teacher's teach us how to put it in our Chromebook. So first you have to open google spreadsheet.
Then you have to write the title colours or food. Then wright what colour it is or foods then wright down the numbers the opposite side of where you wrote down the colours so it is like this in a photo.
After that you have highlight all of the things that you have wrote down in the google spreadsheat like this. So you have to use your mouse to highlight the whole thing because if you don't they wouldn't know that you already made something for the graphs or for the charts.
 Then after you highlight the colours and the numbers you have to press with your mouse a small button it shapes like a graph it looks like this. You can find this little thing at the top side left side of the google spreadsheat.
 After you press that it would look like this it would come up with a pie chart so you could change that by pressing this little button it says pie chart.
Then you could pick anything like bar graph and pie chart after you press the button then it will show you what you can use it would look like this. So after you pick a graph or a chart it would look like this and you are done making a graph or a chart.


No comments:
Post a Comment
To support my learning I ask you to comment as follows:
1. Something positive - something you like about what I have shared.
2. Thoughtful - A sentence to let us know you actually read/watched or listened to what I had to say
3. Something helpful - how have you connected with my learning? Give me some ideas for next time or ask me a question.