Hi,
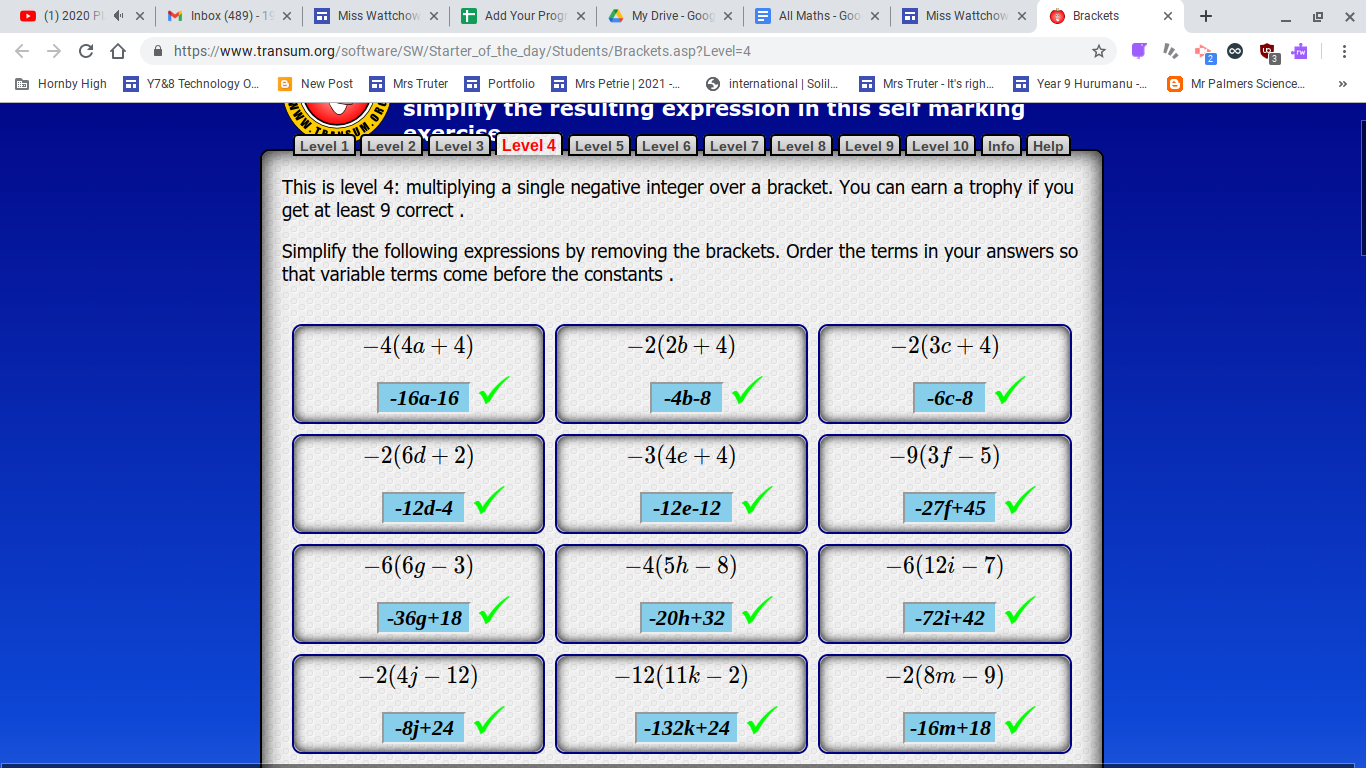
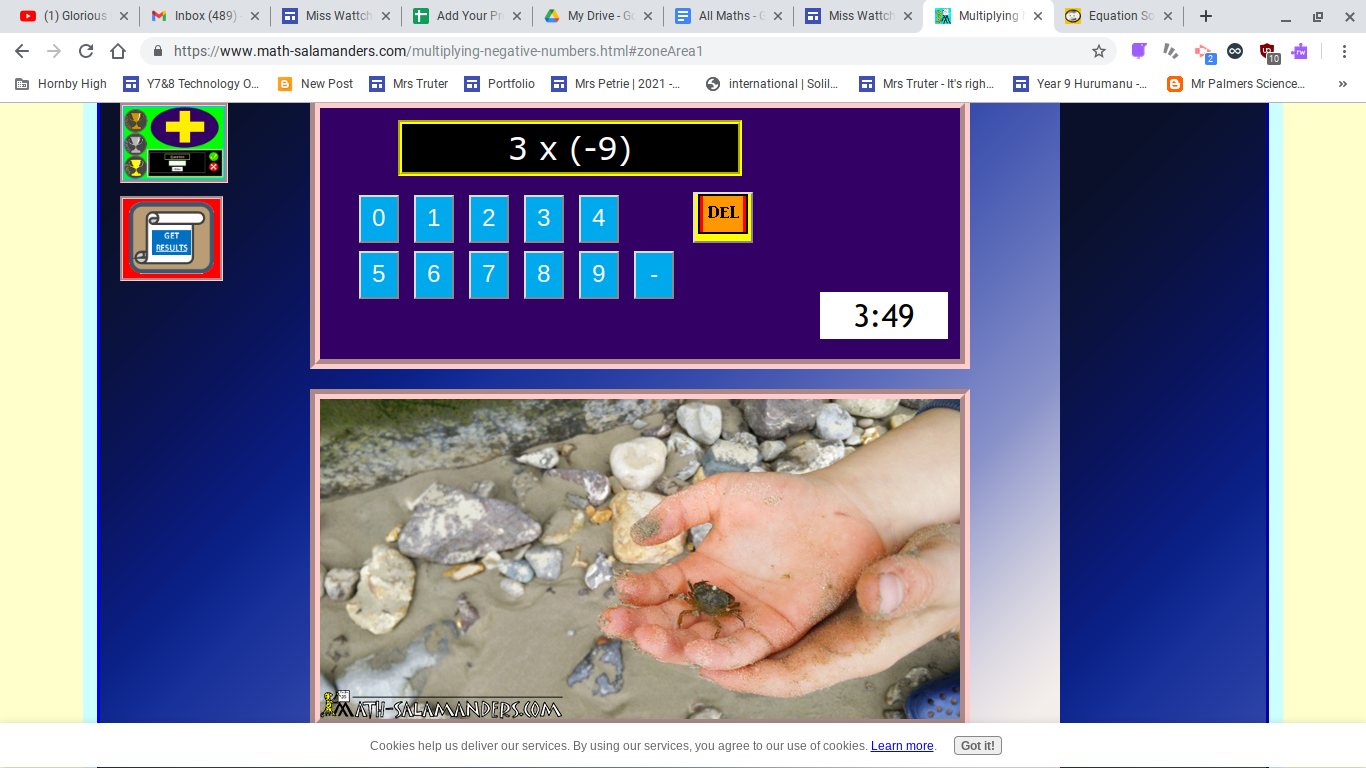
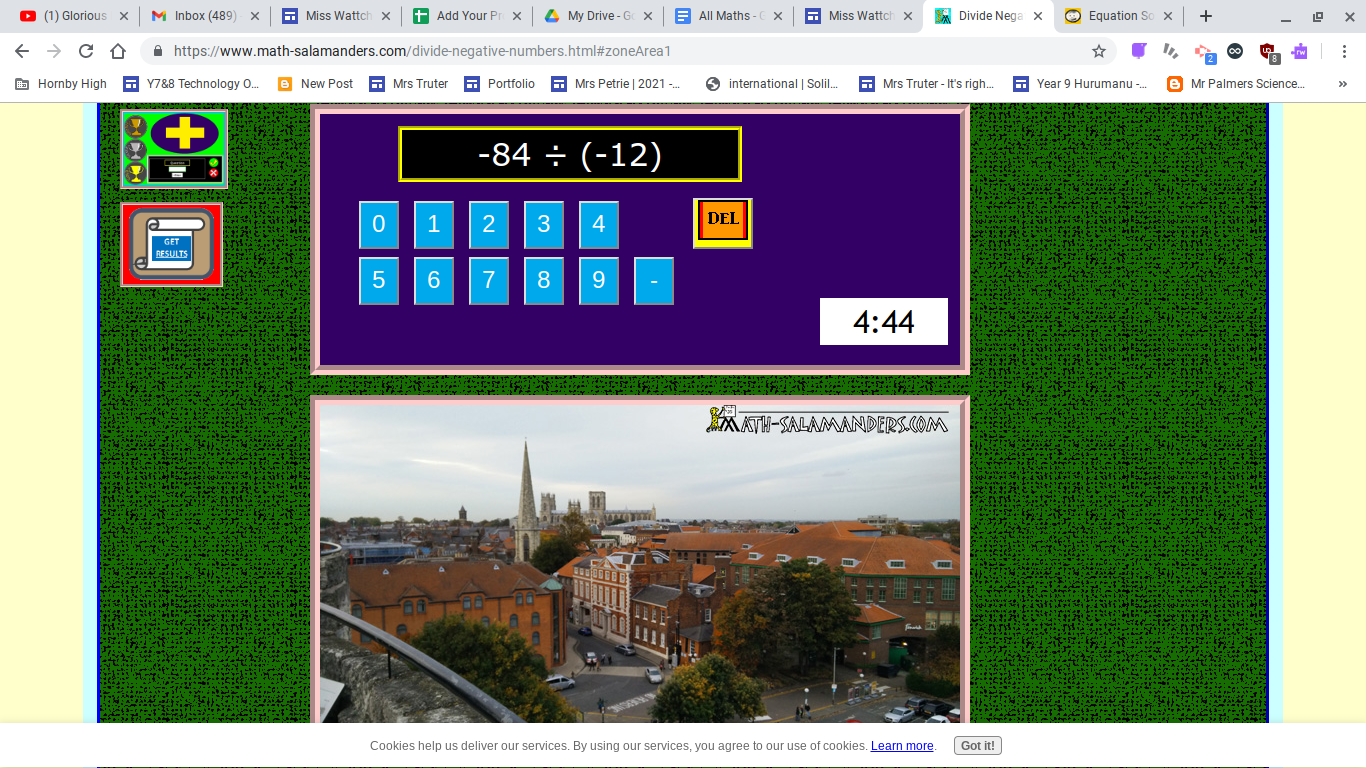
In Maths this week we needed to do some task, here is the task that I have done.
Task:1
Task:2
Task:3

Task:4
Hi,
In Maths this week we needed to do some task, here is the task that I have done.
Task:1
Task:2
Task:3
Task:4
 This is the maths work that I have been doing and we have to estimate the costing of the each of the things they are selling for example ( $ 3 for each chocolate bar ) So here is the work that I have done


 Then after you highlight the colours and the numbers you have to press with your mouse a small button it shapes like a graph it looks like this. You can find this little thing at the top side left side of the google spreadsheat.

 After you press that it would look like this it would come up with a pie chart so you could change that by pressing this little button it says pie chart.